
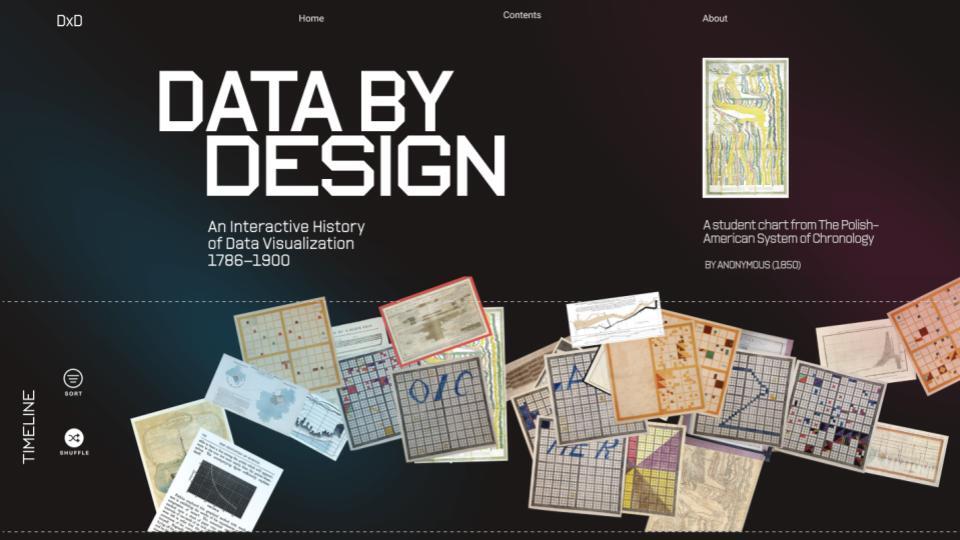
A model of multidisciplinary digital humanities collaboration, Data by Design tells the story of the emergence of modern data visualization using visualization itself. From Spanish colonial surveys to diagrams of international trade, Data by Design confirms how charts have always served power—and also shows how charts can be designed to wield that power back. Published as an interactive website and a dazzling full-color book, Data by Design models how good visualization practice begins not with data, but with ethics and care.
Book:
Data by Design: Visualization and Power from Abolition to the Dawn of Data Science. Lauren Klein with Tanvi Sharma*, Jay Varner, Margy Adams*, Shiyao Li*, Dan Jutan*, Jianing Fu*, Anna Mola*, Nicholas Yang*, Yang Li, Zhou Fang*, and Silas Munro. MIT Press, 2026.
Digital project:
Data by Design: An Interactive History of Visualization and Power, 1789-1900. Lauren Klein, Tanvi Sharma*, Jay Varner, Margy Adams*, Shiyao Li*, Dan Jutan*, Jianing Fu*, Anna Mola*, Nicholas Yang*, Yang Li, Zhou Fang*, and Silas Munro. MIT Press, May 2026.
Journal article:
“What Data Do and Do Not Represent: Visualizing the Archive of Slavery.” Shiyao Li*, Margy Adams*, Tanvi Sharma*, Jay Varner, and Lauren Klein. IEEE Computer Graphics and Applications 45.3 (May-June 2025): 45-57.
Conference proceedings:
Adams, M.*, S. Li*, T. Sharma*, J. Varner, and L. Klein. “Visualizing Resistance in the Archive of Slavery.” Digital Humanities 2025. Association of Digital Humanities Organizations, 2025.